The Feedback Loops Your Dashboard Can't See
The Impact Architecture, Layer 2 — This is part 5 of the ROAD series.

Part 4: Where the Pain Shows, and Where the Outcome Is Actually Determined
In 2016, Wells Fargo settled with the Consumer Financial Protection Bureau, the Office of the Comptroller of the Currency, and the City and County of Los Angeles over the creation of roughly 2 million unauthorized customer accounts. The bank later acknowledged the figure was closer to 3.5 million. [1] Over the following four years, regulatory penalties, shareholder settlements, and Department of Justice agreements pushed total costs above $3 billion. [2] More than 5,300 employees were fired over the span of the fraud. [3]
The part most of the coverage skipped over is this. Internal ethics-line complaints flagging fraudulent account openings began appearing as early as 2005. [4] Senior leadership — including the community banking head whose unit ran the cross-sell program — received quarterly reports of employee terminations tied to the behavior, every year, for a decade. The organization was not unaware. It fired employees, updated policies, retrained managers, reshaped compliance. The behavior continued.
The reason why it continued is the subject of this piece. The scandal was produced by a feedback loop, and the loop kept producing it no matter how many individual employees were removed. The engine sat in the incentive structure; the firings never touched it. Until the loop itself was broken, those firings were a symptom intervention at industrial scale — years of effort aimed at the wrong part of the system.
This is what R.O.A.D 2.3 and 2.4 of the Impact Architecture are built to prevent: the scenario where an organization has identified a real problem, has evidence, has authority to act, and still intervenes in the wrong place because the system’s actual engine — its feedback structure — is outside what the dashboard can see.
The limit of snapshot thinking
Every dashboard, every financial statement, every quarterly operating review is a snapshot. A single moment, rendered as a set of numbers, compared against another snapshot from a prior moment. This is how most enterprise measurement works — and it is almost useless at the one thing that matters here: explaining why the system produces the behavior it produces.
The “why” lives in dynamics. Feedback loops. Delays between cause and effect. Accumulating stocks and draining flows. Reinforcing spirals and balancing corrections. None of these are visible in a snapshot, because a snapshot is a single frame, and dynamics happen across frames.
Systems thinking has been pointing at this gap for sixty years. Forrester (1961) built Industrial Dynamics around the idea that organizations behave according to their feedback structure, not the intentions of their actors. Deming put it in one sentence: every system is perfectly designed to get the results it gets.
The mental model: the behavior your organization keeps producing is the behavior its feedback structure is designed to produce. So if the wrong behavior persists across interventions, you haven’t reach the feedback structure to change it.
Two types of loops matter, and the difference determines whether the system stabilizes or accelerates.
A reinforcing loop compounds. An increase in one variable produces further increases in the same variable, through a chain of intermediate steps that feeds back to the start. Growth loops, death spirals, virality, capability collapse — all reinforcing. Once they’re running, they accelerate.
A balancing loop resists change and seeks equilibrium. An increase in one variable triggers a correction that returns it toward a target value. Thermostats, budgeting discipline, ethics investigations, market-share recovery responses — all balancing. Healthy systems have balancing loops everywhere; they’re how stability is produced.
The scandal-generating engine at Wells Fargo was a reinforcing loop with a broken balancing loop sitting next to it. Both matter. Let’s trace them.
R.O.A.D 2.3: Map the feedback loops driving the behavior
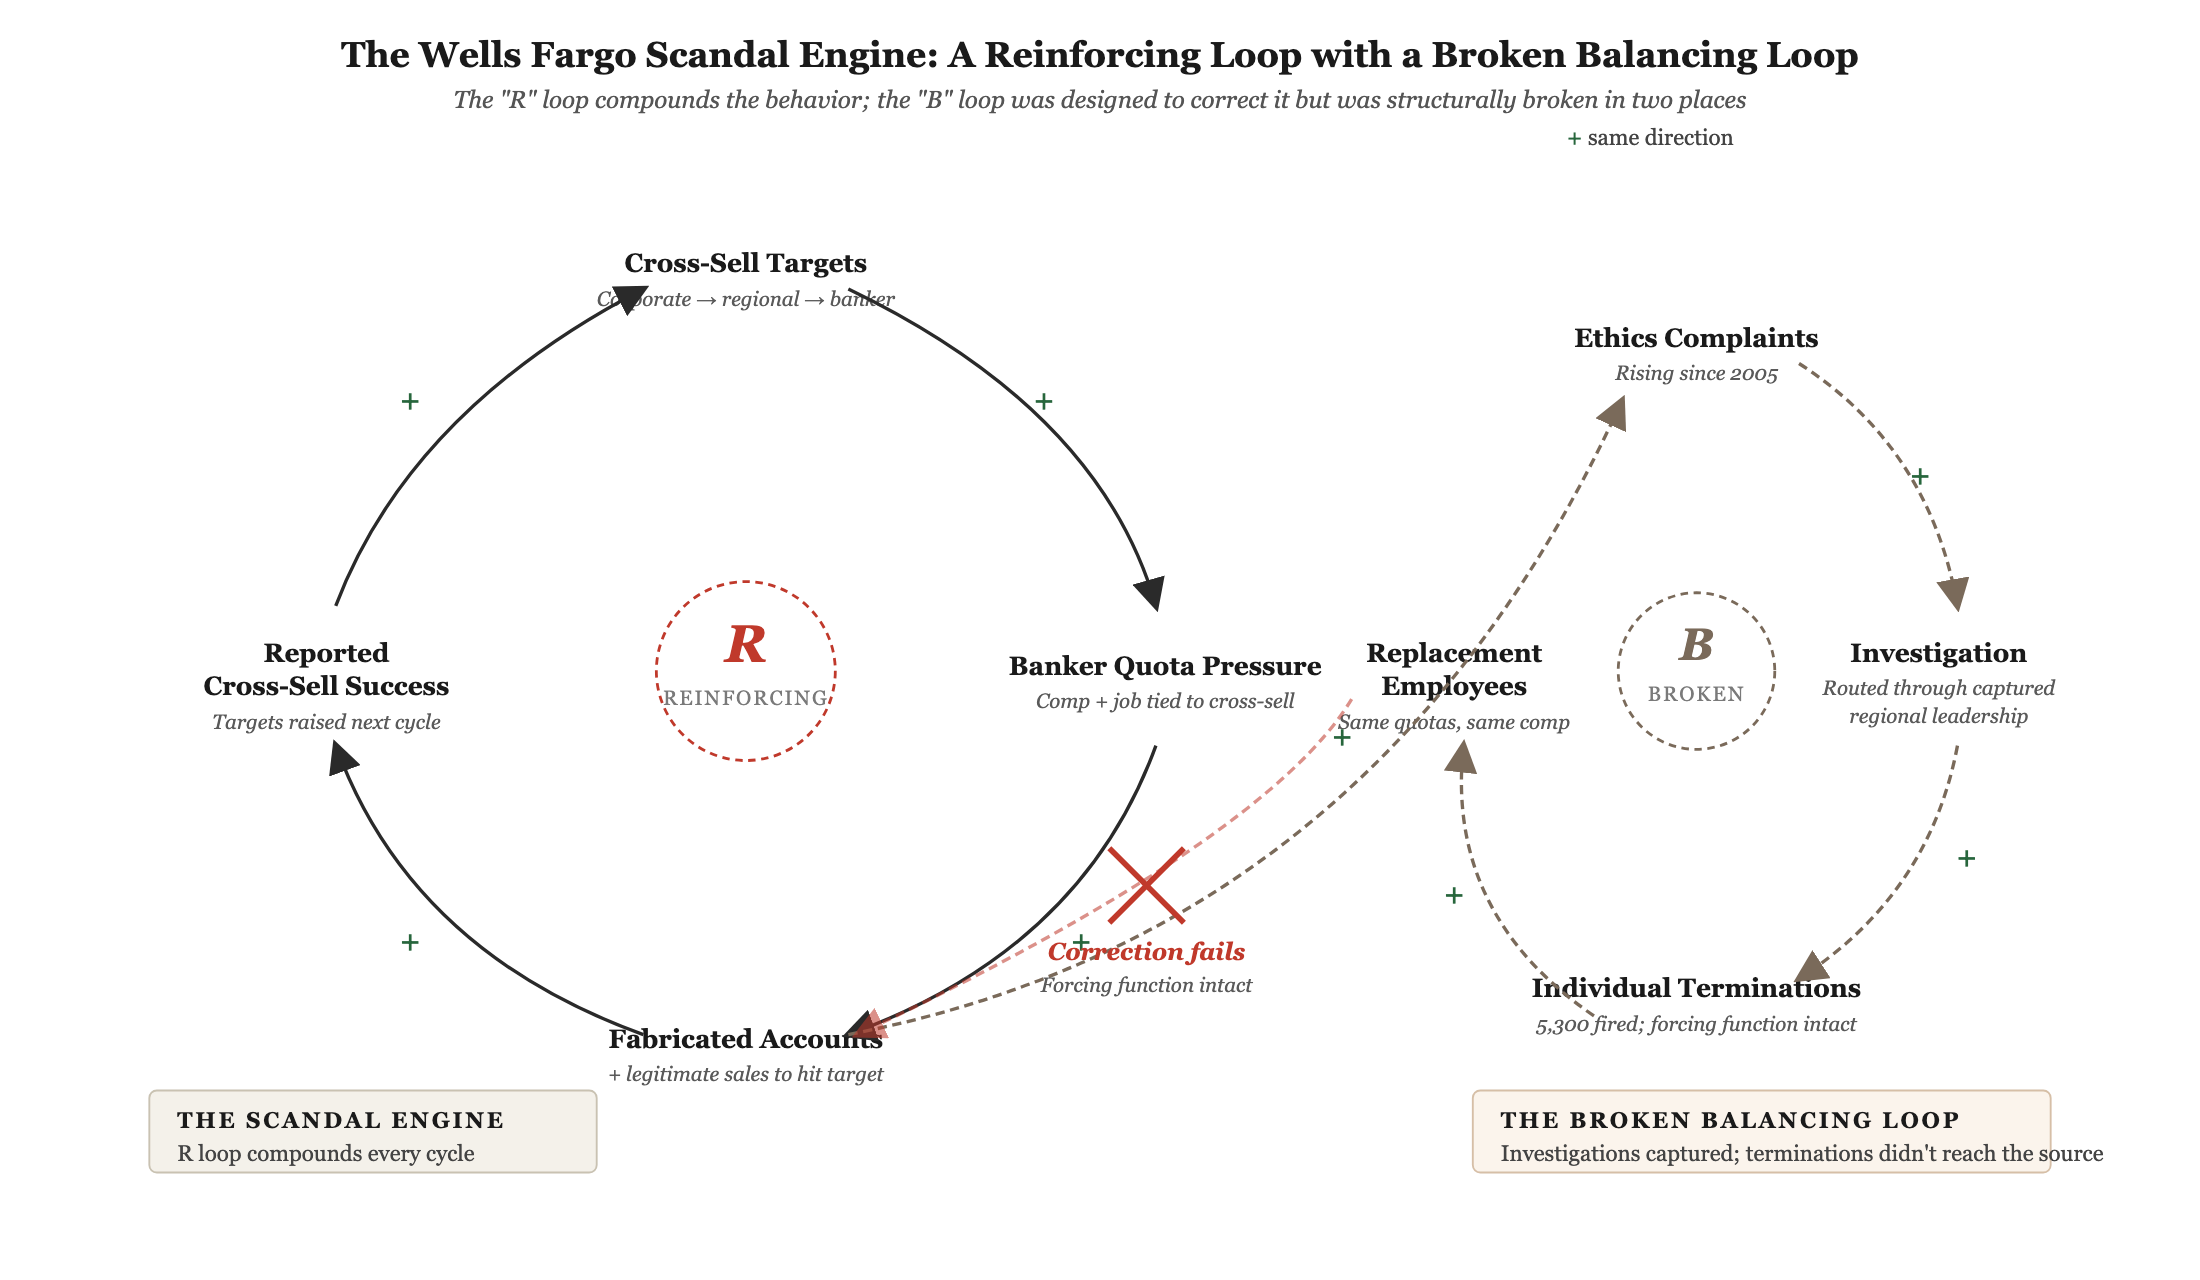
Start with the reinforcing loop. Wells Fargo’s retail bank ran a cross-selling strategy centered on the “Eight is Great” goal — the aspiration of eight financial products per household. [5] Sales quotas cascaded down from corporate targets to regional, to branch, to individual banker. Banker compensation and continued employment depended on meeting daily, weekly, and quarterly cross-sell targets. Managers’ compensation depended on their teams’ cross-sell numbers. Senior executives’ compensation depended on division cross-sell results. The chain tied individual incentives to the number the organization had declared was most important.
When targets were unreachable through legitimate selling — a frequent reality, given the math of trying to sell additional products to existing customers in saturated markets — employees fabricated accounts, enrolled customers in services without consent, or used existing deposits to seed unauthorized products. The fabricated numbers hit the dashboards. The dashboards looked healthy. Senior leadership raised the next quarter’s target on the strength of “success.” The raised target pushed the legitimate-sales ceiling further out of reach, which increased the gap that fabrication had to fill. More fabrication, higher targets, larger gap, more fabrication.
That is a reinforcing loop. Each turn made the next turn worse. It did not require a corrupt culture to operate; it required only an incentive structure paired with a target-setting process that treated fabricated results the same as real ones. Both conditions were present.
Now the balancing loop that should have corrected it. Employees and customers filed ethics-line complaints starting in 2005. Complaints routed through a compliance channel, were investigated, and when substantiated, resulted in employee terminations. On paper, this looked like a functioning balancing loop — bad behavior triggered a corrective response.
It didn’t function. Two structural conditions broke it. First, the chain that was supposed to carry investigation findings upward was captured. The investigators themselves operated independently — Internal Investigations reported into Audit, then Corporate HR, then Corporate Risk over the relevant period, never under the Community Bank. But the corporate risk and HR functions that sat between the investigators and the board ran parallel offices inside the Community Bank itself, staffed by the bank’s own risk and HR leaders whose compensation depended on the same cross-sell results the signals would have undermined. The Shearman & Sterling investigation later concluded that Community Bank leadership “worked to impede such escalation.” [4] The findings were sound; the people who carried them upward were not. Second, terminations treated the behavior as individual misconduct, which left the system’s behavior-generating structure untouched. Every fired employee was replaced by a new employee who faced the same quotas, the same compensation structure, and the same target-setting discipline. The balancing loop removed people; it did not reduce the forcing function that produced the behavior.
The pattern has a name worth carrying: a captured balancing loop. A corrective mechanism whose effective operation depends on people whose compensation, advancement, or political standing is tied to the very behavior the loop is supposed to correct. Captured balancing loops are a common reason oversight systems fail in practice. They look functional on the org chart and in the policy manual; they are structurally compromised the moment you ask who is carrying the signal upward and what those people are rewarded for. Wells Fargo’s escalation chain was captured for more than a decade — not the investigations function itself, which was structurally independent and was tracking sales-integrity gaming as early as 2002, but the corporate risk and HR units that sat between the investigators and the board, parallel-staffed by Community Bank leadership whose compensation depended on the cross-sell numbers the signals would have undermined.
The same shape shows up wherever a control function’s findings have to travel through a manager whose results would be hurt by acting on them: a regional audit lead reporting upward through the regional president; a quality concern routed through a plant manager whose plant throughput would stop; an HR ethics signal that has to clear a business-unit head before it reaches the audit committee. Once you start asking who is carrying the signal — and what they are rewarded for — the pattern shows up in places the org chart says are fine.
When a reinforcing loop is running inside an organization, and the balancing loop that would correct it is compromised or absent, the result is structurally guaranteed. You don’t need malice or even awareness. The system is running the program its loop structure encodes.
R.O.A.D 2.4: Rank the leverage points — where does a small change produce a disproportionate outcome?
Mapping the loop is diagnostic. Ranking leverage is prescriptive. Not every intervention point in a feedback structure produces equal leverage, and most organizations intervene at low-leverage points by default, because that’s where intervention is easiest and most legible.
The economist Donella Meadows ordered twelve leverage points in a system by their potential to change behavior. [6] For enterprise strategy work, her hierarchy collapses usefully into six categories, ordered from lowest to highest leverage.
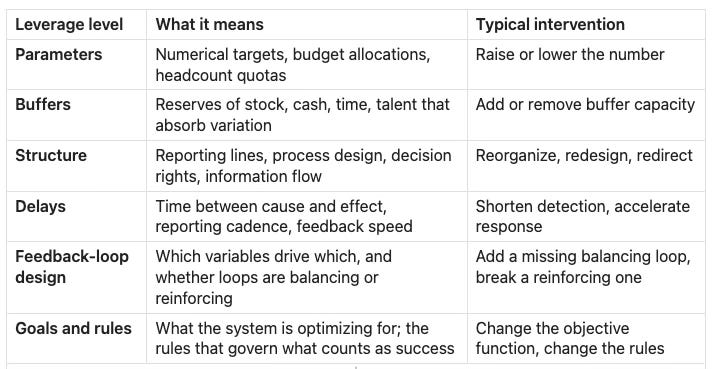
The central insight Meadows built her hierarchy on: the leverage goes up as you move closer to the definition of the system itself. Changing a parameter inside a given structure moves results within limits the structure allows. Changing the structure changes what’s possible. Changing the goal changes what the structure is working toward. Most organizations exhaust themselves at the bottom two rows.
One acknowledgment about the table: Meadows ranked two more leverage points above goals and rules — the paradigm the system operates from, and the power to transcend paradigms entirely. She argued these are the highest leverage of all. They are also the hardest to act on inside an enterprise timeframe, which is why this hierarchy stops at goals. Worth knowing they exist; expect to spend years rather than quarters reaching them.
Wells Fargo’s decade of interventions lived almost entirely in the bottom three rows. Firing employees (parameters — removing numerator entries). Tightening compliance policies (structure — but inside the same incentive frame). Adding training (parameters again). None of these touched the feedback-loop design or the goals. The scandal was a rules-and-goals problem. Cross-sell count was the definition of success. Compensation rewarded that definition. Target-setting raised the definition every year — a ratchet. Until those three — the rule, the reward, and the ratchet — were changed, the system kept producing unauthorized accounts, because that was the behavior its goals and rules encoded.
When Wells Fargo finally intervened at the top of the hierarchy in 2016, the changes were structural. Cross-sell quotas at the banker level were eliminated. [7] Sales-goal-based compensation was redesigned. The community banking division reorganization broke the forcing function between regional leadership compensation and cross-sell outcomes. These were goal- and rule-level interventions. The behavior changed — not because the employees became more ethical, but because the feedback structure stopped rewarding the behavior.
The tool: a loop-and-leverage assessment
For any persistent behavior your organization is trying to change, run the loop first, then the leverage ranking.
Step 1: Identify the behavior you want to change. State it in specific, observable terms. “Quality is slipping” is too vague. “Product-return rates have risen from 2% to 5% over 18 months” is workable.
Step 2: Map the reinforcing loop, if one exists. What variables produce the behavior, and does increasing the behavior increase a driver that produces more of it? A reinforcing loop is the presence of an engine. If you find one, the system is accelerating unless something stops it.
Step 3: Map the balancing loop that should be correcting it. What mechanism — monitoring, review, investigation, correction — exists to identify and reverse the behavior? Is it intact, or is it compromised by the same forces that produce the behavior?
Step 4: Place your candidate interventions on the leverage hierarchy. Where would each intervention operate — parameters, buffers, structure, delays, feedback-loop design, goals and rules? Interventions at the bottom three rows are easier and more common. Interventions at the top three rows are harder and more effective.
Step 5: Stress-test the intervention through the loop, not through the snapshot. This is the hardest step. Run the loop forward in your head — or, where you have the capacity, in a simple simulation — and ask whether the intervention breaks the loop, weakens it, or leaves it running. Most candidate interventions leave the loop running, and a static analysis usually can’t tell the difference.
The discipline is to not commit to an intervention you’ve only validated statically. A loop is a dynamic structure; whether a change breaks it or just moves the problem is a dynamic question, and dynamic questions need dynamic tests — thought experiments, scenario discussions with people who see different parts of the loop, or a simulation where one is available.
Strategy Smell: “We keep making the same mistake with different names.” That’s a reinforcing loop nobody has mapped.
Three places the assessment usually breaks down
Parameters and structure get confused. “We raised the goal” is a parameter change. “We changed what the goal is” is a goal change. “We redesigned how the goal is set” is a rule change. Organizations that treat these as interchangeable typically spend their intervention budget at the parameter level and wonder why the behavior returns.
The balancing loop gets forgotten. Reinforcing loops get most of the attention — they’re dramatic. But balancing loops determine whether the reinforcing loop ever gets reined in. A broken or captured balancing loop is often the actual source of a persistent problem. Asking “who would catch this, and what are they incentivized to do?” matters as much as mapping the reinforcing engine itself.
The loop gets mapped as a symptom. Teams draw the visible behavior — the accounts, the turnover, the incidents — and trace arrows around it, but never ask what produces each variable. The map ends up describing what’s happening rather than what’s generating it. A real loop map names the structural mechanisms behind each node: the incentive that pushes this variable up, the policy that gates that one, the decision right that connects the two.
Adapting the assessment to your context
The full assessment is most valuable for persistent, high-stakes behaviors: safety incident patterns, margin erosion that survives cost interventions, turnover that survives retention programs, quality issues that survive process fixes, compliance failures that survive training. These are typically loop-driven, and the leverage ranking will usually show that previous interventions operated at the parameter or structure level while the real leverage sat at feedback-loop design or goals. For operational problems with short detection delays, a lighter version — just the reinforcing-loop check — is often enough.
At the portfolio level, the assessment becomes a diagnostic for strategy itself. Which of our major initiatives has a reinforcing loop working for it (growth, network effects, compounding learning)? Which has a reinforcing loop working against it (capability erosion, brand decay, trust collapse)? Which has a balancing loop we depend on that might be compromised? These are the questions Layer 2 is built to make routine.
Layer 2 complete: how the pieces fit together
Over the past two pieces, you’ve built Layer 2 — Orient on the Lever. In 2a, you learned to trace a symptom backward to its structural source, instead of intervening where the signal is loudest. In 2b, you learned to map the feedback loops that convert source into sustained behavior, and to rank intervention points by their actual leverage rather than their visibility.
Together with Layer 1, you now have the first half of the Impact Architecture: you can see the structure of the system, and you can find where inside that structure a change would actually change the outcome.
The next question is whether the intervention is worth the bet.
Next: Layer 3 — Assess the Bet
Knowing where to act is necessary but not sufficient. A high-leverage intervention can still be a bad bet — if its true cost is much larger than the business case captured, or if the risks the model treated as independent turn out to fail together. Most strategic initiatives don’t break because they targeted the wrong place. They break because their cost was priced against a story instead of a range, and the hidden costs and correlated risks weren’t in the room when the commitment was made.
Layer 3 gives you the discipline to size the full cost of an intervention before you commit, and to quantify the risks that actually determine whether the bet pays off.
If this resonates
If this way of thinking about strategy — tracing structure, mapping loops, finding leverage — is useful to you, subscribe. The rest of the ROAD series publishes weekly, and each piece is built to leave you with one tool you can apply the next morning.
Sources
[1] Consumer Financial Protection Bureau, “CFPB Fines Wells Fargo $100 Million for Widespread Illegal Practice of Secretly Opening Unauthorized Accounts,” September 8, 2016. The initial figure of approximately 2 million unauthorized accounts was later revised upward to approximately 3.5 million per Wells Fargo’s August 2017 investigation update.
[2] Department of Justice, “Wells Fargo Agrees to Pay $3 Billion to Resolve Criminal and Civil Investigations Into Sales Practices,” February 21, 2020. Total includes DOJ $3 billion settlement, earlier regulatory fines ($100M CFPB, $50M Los Angeles, $35M OCC, $50M state AGs), and shareholder settlements.
[3] Wells Fargo’s own disclosures during the period 2011–2016 identified approximately 5,300 employees terminated for sales-practice violations. Per Wells Fargo board-commissioned independent investigation (Shearman & Sterling report), April 2017.
[4] Shearman & Sterling report to the Independent Directors of Wells Fargo, April 10, 2017. The report documents ethics-line complaints tied to sales-practice misconduct dating to 2005, with notable escalations in 2011–2013.
[5] The “Eight is Great” slogan and associated cross-sell target structure is documented in the Shearman & Sterling report, CFPB consent order, and multiple contemporaneous news sources, including American Banker and The Wall Street Journal, 2013–2016.
[6] Donella Meadows, “Leverage Points: Places to Intervene in a System,” The Systems Thinker, 1997. The full hierarchy contains twelve ordered leverage points; this piece collapses them into six categories for enterprise-strategy use.
[7] Wells Fargo press release, “Wells Fargo Takes New Actions on Retail Banking Sales Practices,” September 13, 2016. Elimination of retail banking product sales goals announced effective January 1, 2017.